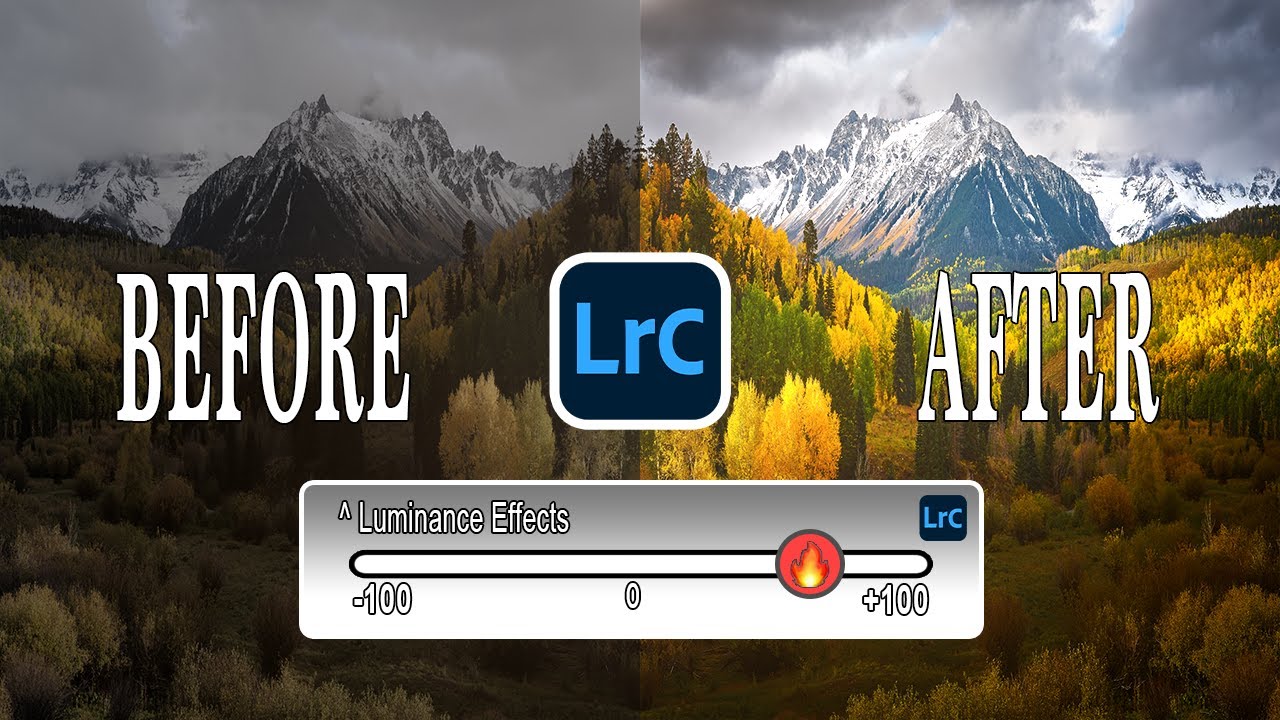
There’s a certain kind of Lightroom knowledge that separates people who edit photos from people who understand what they’re doing to photos. For a long time, I was firmly in the first camp. I’d drag sliders around in the Basic panel until things looked good, occasionally glancing at the histogram like it was a car dashboard warning light I didn’t fully understand. It was decoration. Background noise. I knew it mattered, but I treated it like I treat the fine print on a software license.
Then I watched Watch the full tutorial on YouTube by Mark Denney, and something clicked. Not just about the histogram, but about a specific interactive feature inside it that most beginners never discover and that even intermediate editors tend to miss entirely. It’s not buried in some obscure menu. It’s sitting right there at the top of your Develop module, waiting.
The short version: you can click and drag directly on the histogram to adjust your tonal values in real time, without touching a single slider in the Basic panel. The histogram isn’t just a readout. It’s a control surface. And once you start using it that way, going back to only using the sliders feels like taking the long way home.
Step 1: Open the Develop Module and Find the Histogram
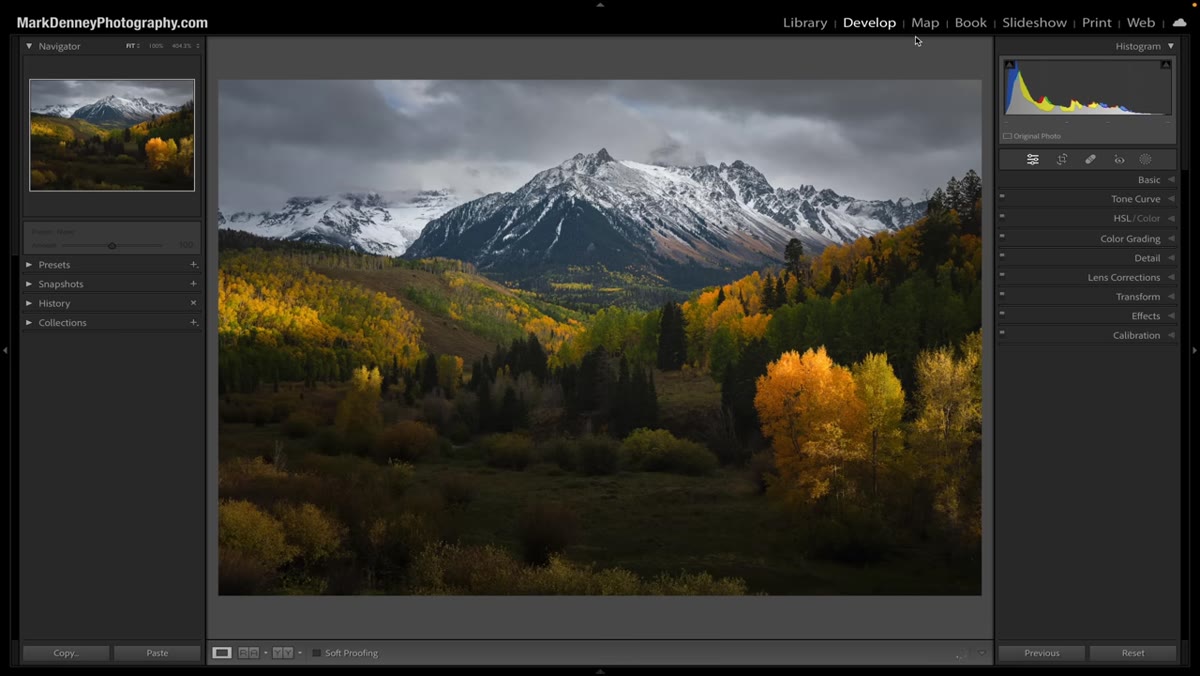 Hovering over the Develop module histogram panel
Head into the Develop module if you’re not already there. The histogram lives at the top right of the panel column, above the Basic adjustments. Most people see it and keep scrolling. What Denney shows in this tutorial is that the histogram is divided into interactive zones that correspond directly to your tonal sliders below: Blacks on the far left, Shadows next, then Exposure in the wide center, then Highlights, and Whites on the far right.
Hovering over the Develop module histogram panel
Head into the Develop module if you’re not already there. The histogram lives at the top right of the panel column, above the Basic adjustments. Most people see it and keep scrolling. What Denney shows in this tutorial is that the histogram is divided into interactive zones that correspond directly to your tonal sliders below: Blacks on the far left, Shadows next, then Exposure in the wide center, then Highlights, and Whites on the far right.
To see these zones labeled, just hover your mouse slowly across the histogram from left to right. Lightroom will display the name of each zone as you move through it, along with the current value of that slider. This alone was useful enough to make me pause the video and go check my own edits.
Step 2: Click and Drag the Whites Zone
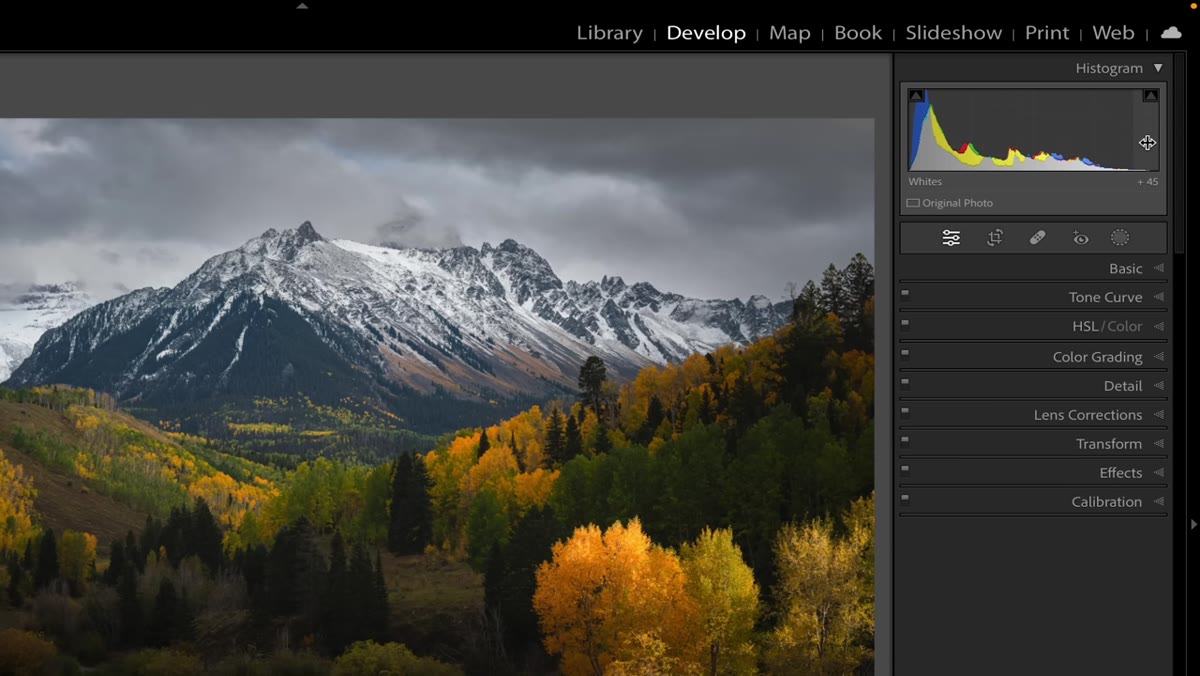 Dragging the Whites zone on the histogram right and left
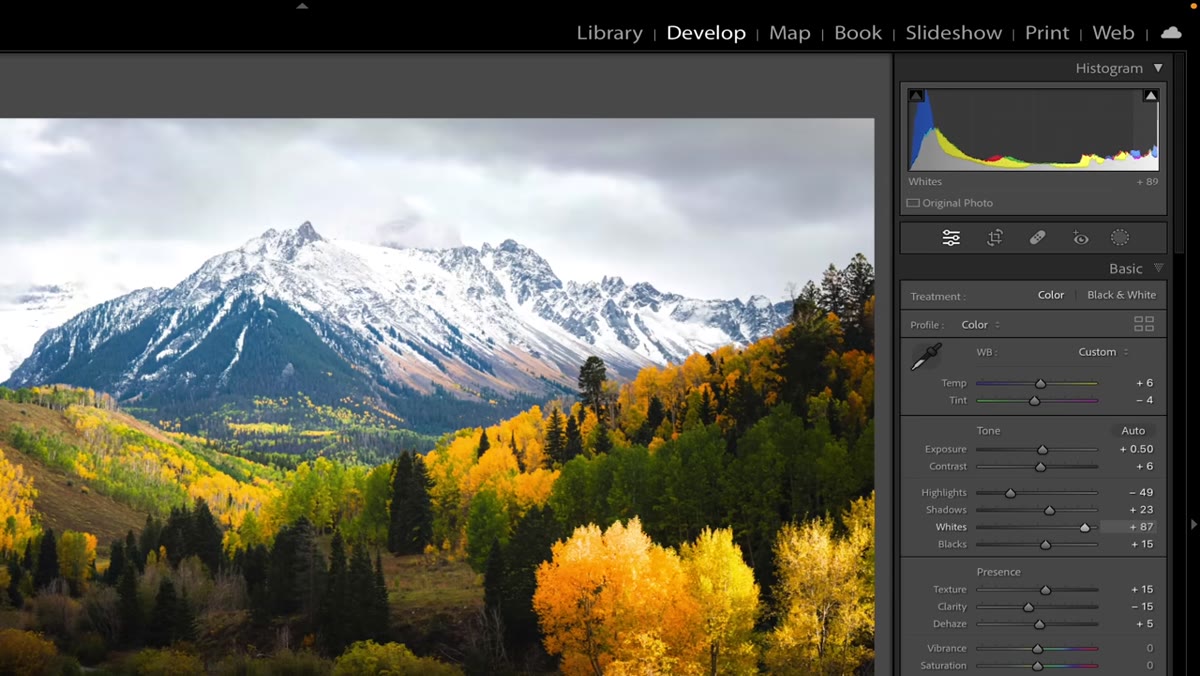
Position your cursor at the far right edge of the histogram until you see “Whites” appear. Click and drag left to pull the whites down, or right to push them up. You’ll immediately see two things happen simultaneously: the histogram shape shifts in real time, and the Whites slider in your Basic panel moves to match. They’re fully linked.
Dragging the Whites zone on the histogram right and left
Position your cursor at the far right edge of the histogram until you see “Whites” appear. Click and drag left to pull the whites down, or right to push them up. You’ll immediately see two things happen simultaneously: the histogram shape shifts in real time, and the Whites slider in your Basic panel moves to match. They’re fully linked.
In Denney’s Colorado aspen photo, his Whites were already sitting at plus 45. Dragging the histogram zone let him see exactly how that value was affecting the bright end of the tonal range without having to scroll down to the Basic panel. For anyone who wants to understand why a slider is set where it is, rather than just copying a number from a tutorial, this kind of visual feedback is hard to beat.
Step 3: Adjust the Highlights Zone
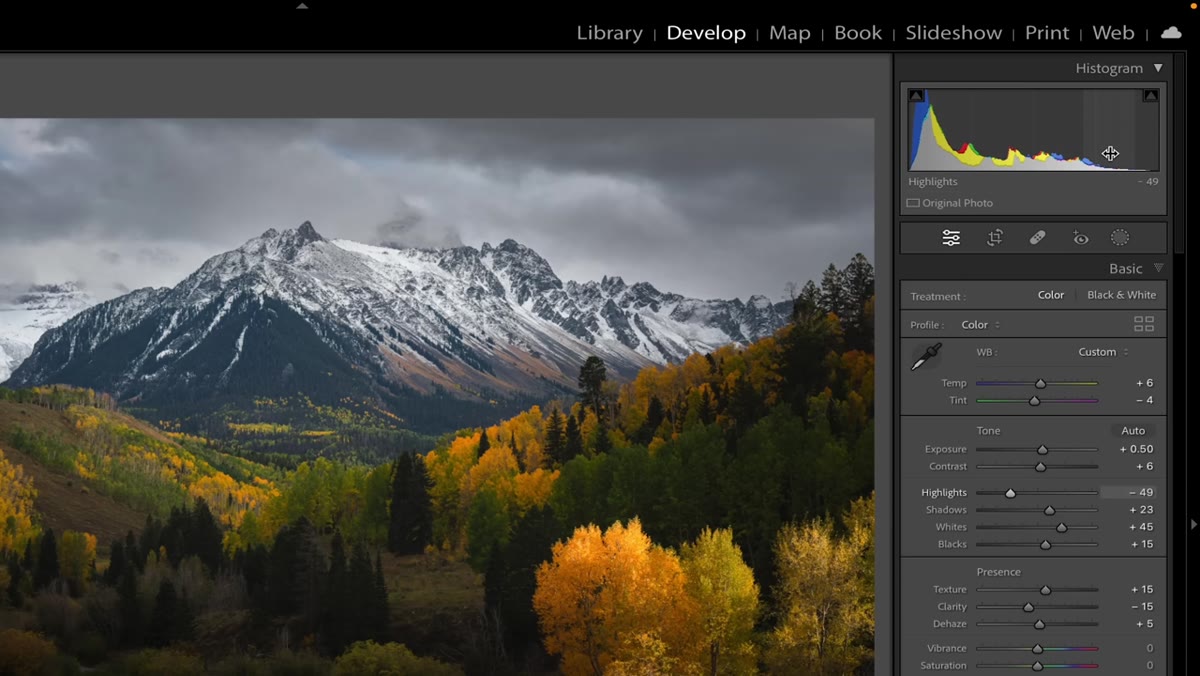 Highlights zone selected, histogram shifting left as value decreases
Move your cursor slightly left from the Whites zone and you’ll land on Highlights. Same mechanic applies: click and drag to adjust, watch the histogram respond in real time. In the tutorial example, Highlights were pulled down to around minus 49, which recovers detail in bright areas without flattening the overall exposure.
Highlights zone selected, histogram shifting left as value decreases
Move your cursor slightly left from the Whites zone and you’ll land on Highlights. Same mechanic applies: click and drag to adjust, watch the histogram respond in real time. In the tutorial example, Highlights were pulled down to around minus 49, which recovers detail in bright areas without flattening the overall exposure.
The reason this is worth doing from the histogram rather than the slider is spatial. You can see the shape of the histogram change right where the highlights actually live. When you drag the slider in the Basic panel, your eyes have to jump between the image, the histogram, and the slider value. Working directly on the histogram keeps everything in one place.
Step 4: Control Blacks and Shadows from the Left Side
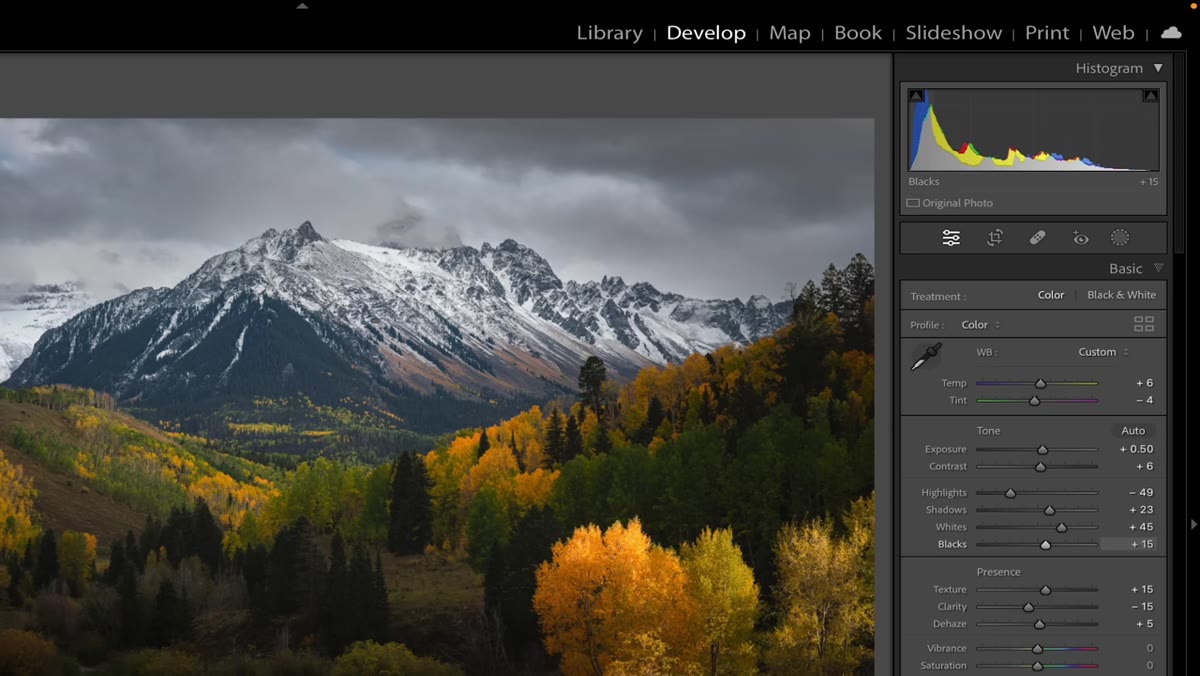 Blacks zone dragged far left, shadow area of histogram shifting
Shift your attention to the left side of the histogram. The far left zone controls Blacks, and the zone just right of it handles Shadows. Both respond to the same click-and-drag interaction. Dragging Blacks to the left deepens them, pushing the darkest tones further into true black. Pulling right lifts the black point and opens up detail in the darkest parts of your image.
Blacks zone dragged far left, shadow area of histogram shifting
Shift your attention to the left side of the histogram. The far left zone controls Blacks, and the zone just right of it handles Shadows. Both respond to the same click-and-drag interaction. Dragging Blacks to the left deepens them, pushing the darkest tones further into true black. Pulling right lifts the black point and opens up detail in the darkest parts of your image.
Shadows work the same way, but they affect a broader tonal range. Denney demonstrates dragging each zone to its extremes so you can clearly see how the histogram shape changes. Watching the left side of the histogram bunch up or spread out while you drag is one of the fastest ways to build an intuition for what these adjustments actually do to an image.
Step 5: Use the Center Zone for Exposure
 Center Exposure zone dragged right, entire histogram shifting together
The largest zone in the middle of the histogram is Exposure, and it behaves differently from the others. When you drag it, the entire histogram shifts left or right as a unit. Everything moves together: highlights, midtones, shadows, all of it. This is a global brightness adjustment, and seeing the whole histogram slide in real time makes it immediately obvious why Exposure is such a powerful and sometimes destructive tool when overused.
Center Exposure zone dragged right, entire histogram shifting together
The largest zone in the middle of the histogram is Exposure, and it behaves differently from the others. When you drag it, the entire histogram shifts left or right as a unit. Everything moves together: highlights, midtones, shadows, all of it. This is a global brightness adjustment, and seeing the whole histogram slide in real time makes it immediately obvious why Exposure is such a powerful and sometimes destructive tool when overused.
Denney points out that this center zone dominates most of the histogram’s real estate, which makes sense. Exposure influences the whole image. Using it from the histogram rather than the slider gives you an almost tactile sense of how far you’re pushing the overall brightness before things start clipping.
Step 6: Watch the Clipping Indicators as You Edit
 Histogram zones being adjusted with clipping visible at edges
As you drag any of these zones to extremes, pay attention to the edges of the histogram. When data starts to pile up against the left or right wall, you’re clipping. On the right side, that means blown highlights with no recoverable detail. On the left, it means crushed blacks. The histogram makes clipping visible the moment it starts to happen, which means you can stop just before you go too far.
Histogram zones being adjusted with clipping visible at edges
As you drag any of these zones to extremes, pay attention to the edges of the histogram. When data starts to pile up against the left or right wall, you’re clipping. On the right side, that means blown highlights with no recoverable detail. On the left, it means crushed blacks. The histogram makes clipping visible the moment it starts to happen, which means you can stop just before you go too far.
This is something sliders alone don’t tell you as clearly. You can have the Highlights slider at minus 100 and still be clipping if the whites are too high. Working from the histogram gives you the full picture of how all these zones interact.
My Own Take: This Changed How I Teach Histogram Basics
I’ve been recommending this technique to anyone who asks me how to stop being afraid of the histogram. When I learned Lightroom years ago, editing press shots for my band on a tight deadline, someone pointed me to the Basic panel and said “start here.” Nobody mentioned the histogram was interactive. I probably would have figured it out faster if they had.
The thing I’d add to what Denney shows: try using histogram-based editing as your first pass before you touch any sliders. Get your tonal balance roughed in by dragging the zones directly, then fine-tune individual values in the Basic panel. It changes how you think about exposure and tonal balance because you’re responding to the shape of the image data, not just a number on a slider.
The single most useful thing this tutorial gave me was a reason to actually interact with the histogram instead of just reading it. It’s one of those features that feels obvious in hindsight, the kind where you wonder why nobody mentioned it sooner. If you want to see exactly how Denney demonstrates it on a real landscape image with before-and-after context, Watch the full tutorial on YouTube and keep your Develop module open while you do.
Comments
Leave a Comment